| Minute | Player…2 | Squad | xG | PSxG | Outcome | Distance | Body Part | Notes | Player…10 | Event…11 | Player…12 | Event…13 |
|---|---|---|---|---|---|---|---|---|---|---|---|---|
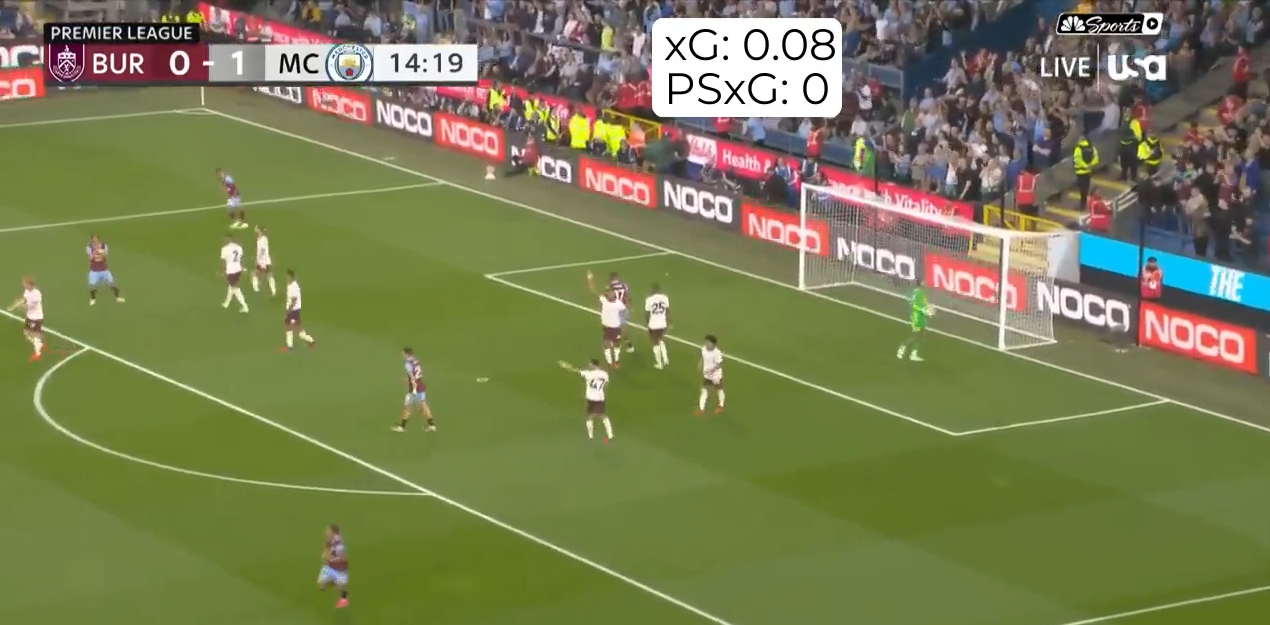
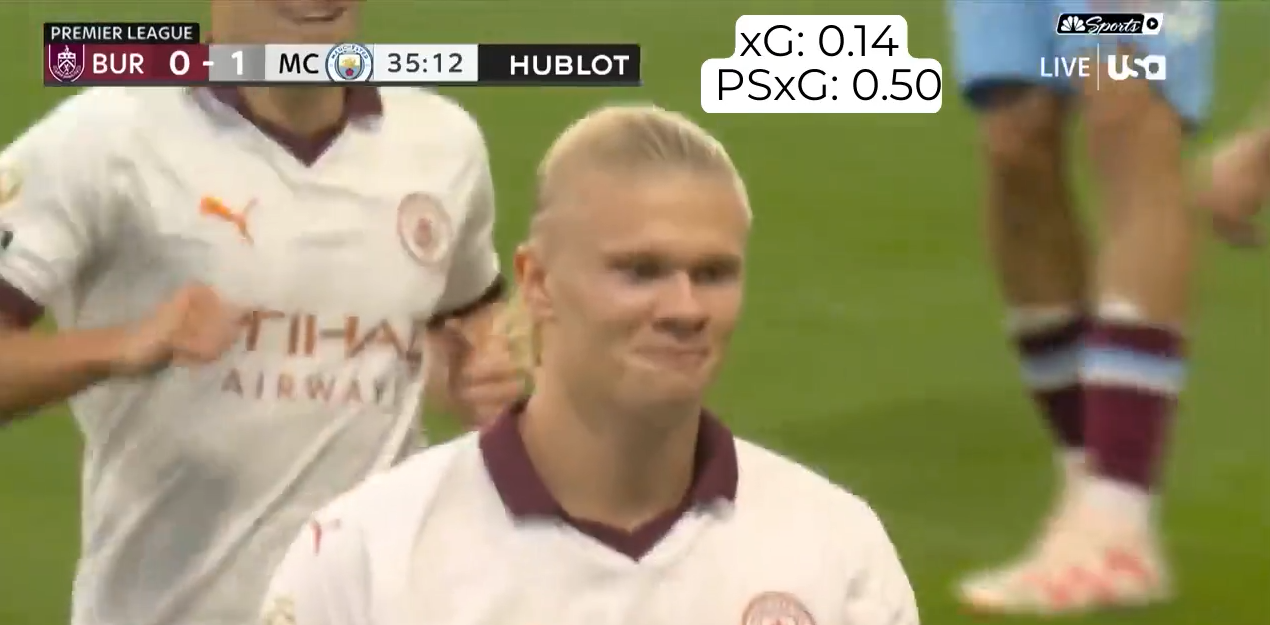
| 4 | Erling Haaland | Manchester City | 0.17 | 0.62 | Goal | 8 | Left Foot | Volley | Rodri | Pass (Live) | Kevin De Bruyne | Pass (Live) |
| 6 | Kevin De Bruyne | Manchester City | 0.02 | 0.00 | Off Target | 32 | Right Foot | NA | Phil Foden | Pass (Live) | Nathan Aké | Pass (Live) |
| 11 | Erling Haaland | Manchester City | 0.21 | 0.00 | Off Target | 6 | Right Foot | Volley | Kevin De Bruyne | Pass (Live) | Rodri | Pass (Live) |
| 15 | Luca Koleosho | Burnley | 0.08 | 0.00 | Off Target | 15 | Right Foot | NA | Vitinho | Pass (Live) | Lyle Foster | Pass (Live) |
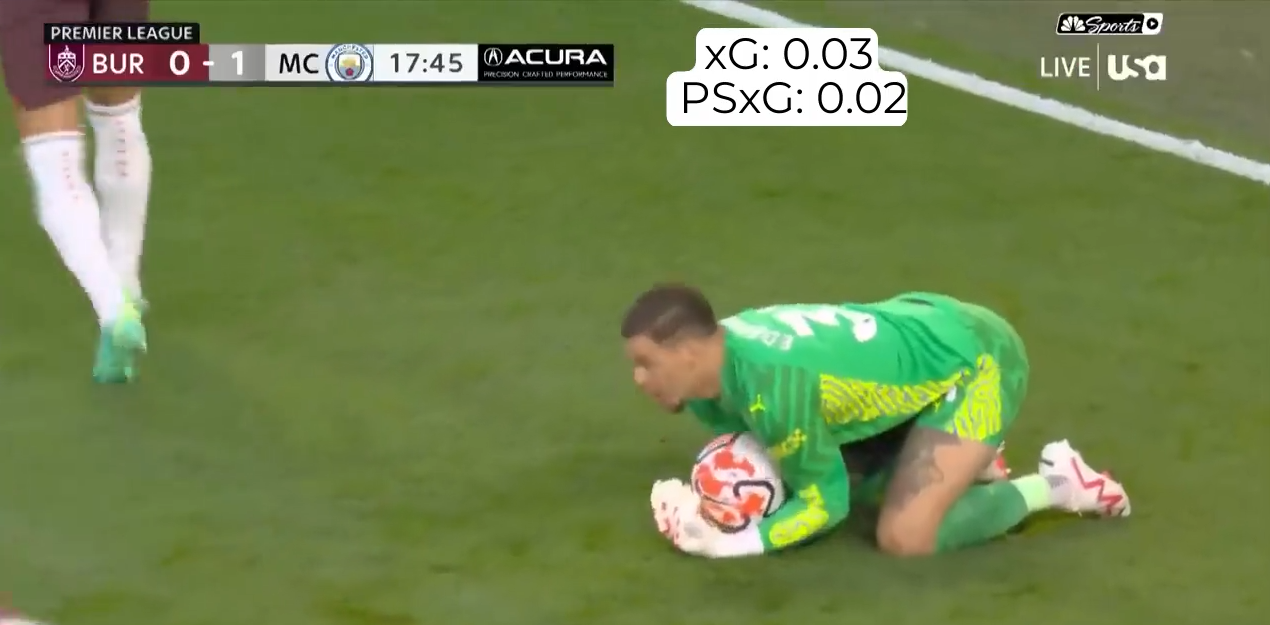
| 18 | Zeki Amdouni | Burnley | 0.03 | 0.02 | Saved | 15 | Left Foot | NA | Luca Koleosho | Pass (Live) | Vitinho | Pass (Live) |
Expected Goals is the premier stat in the world of soccer analytics. After struggling to make the jump from research to the media, it’s now a staple statistics in every broadcast.
But the some of the early pushback still remains, and it’s often quoted as an afterthought and without much comprehension. I thought a good idea would be to incorporate it into highlights to reinforce what it means.
The table below is the first five rows xG data from Burnley x Man City in the 2023-24 season.
See the still images resulting from my poor video editing.
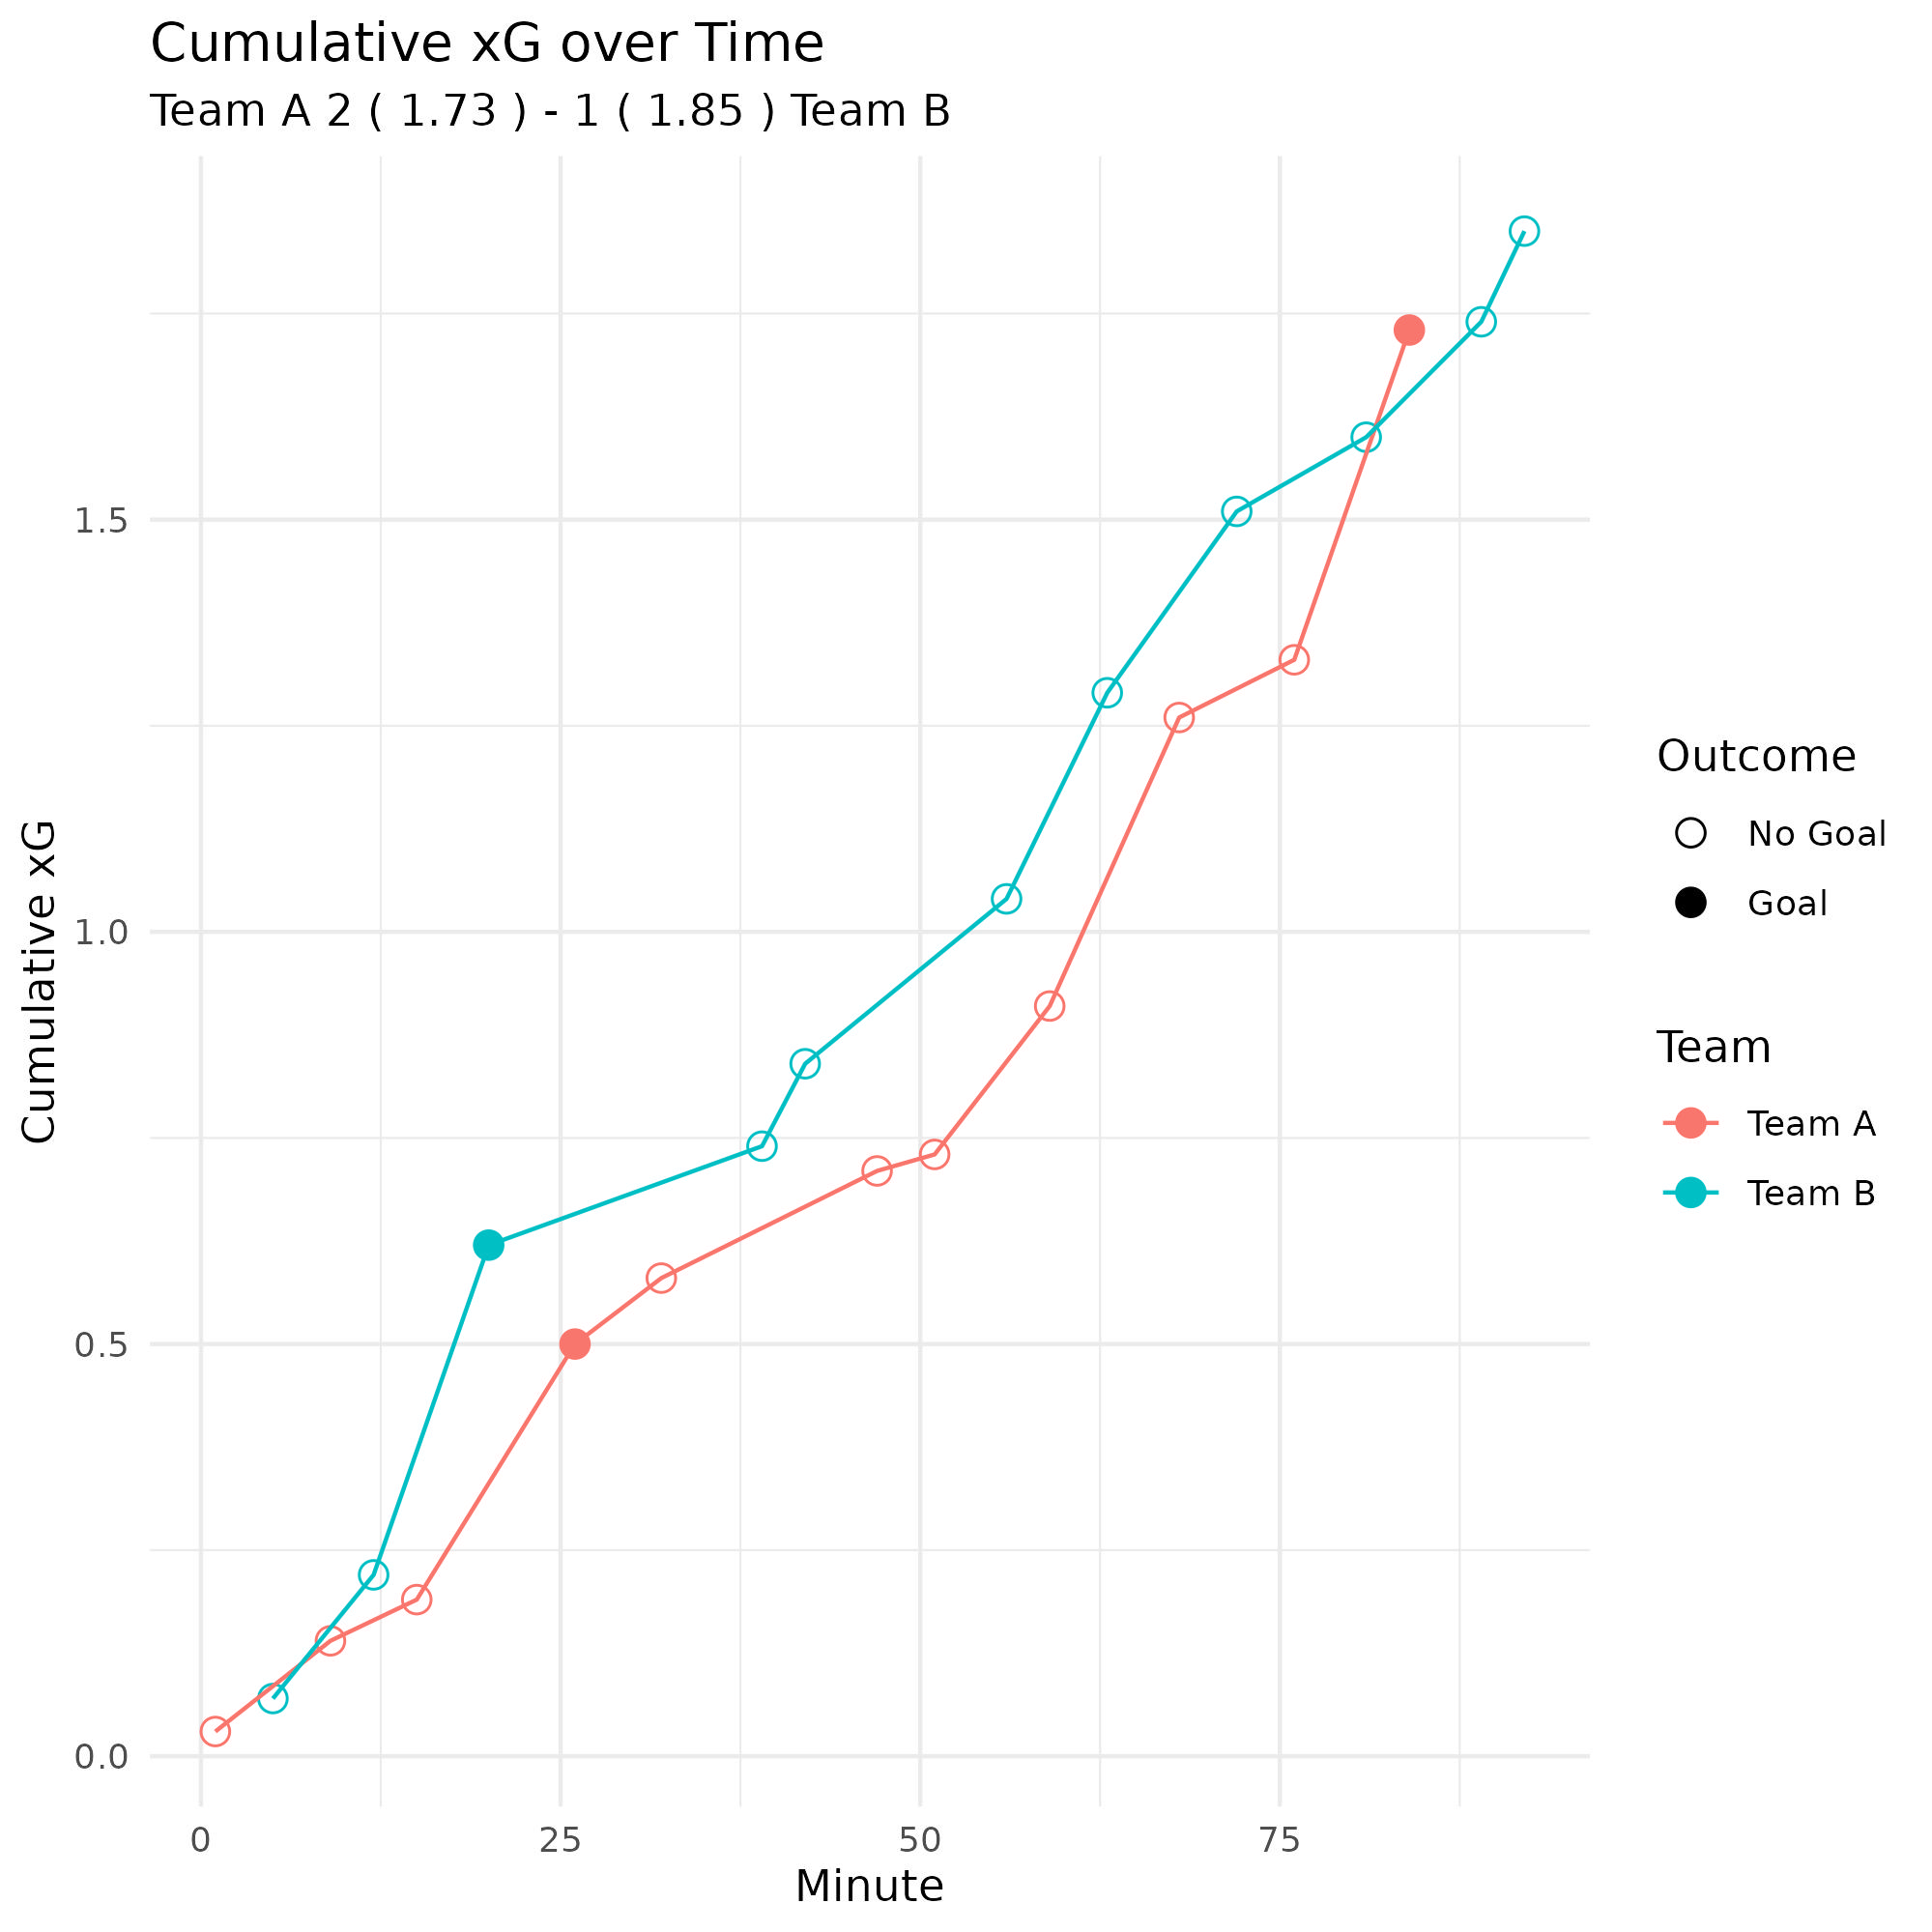
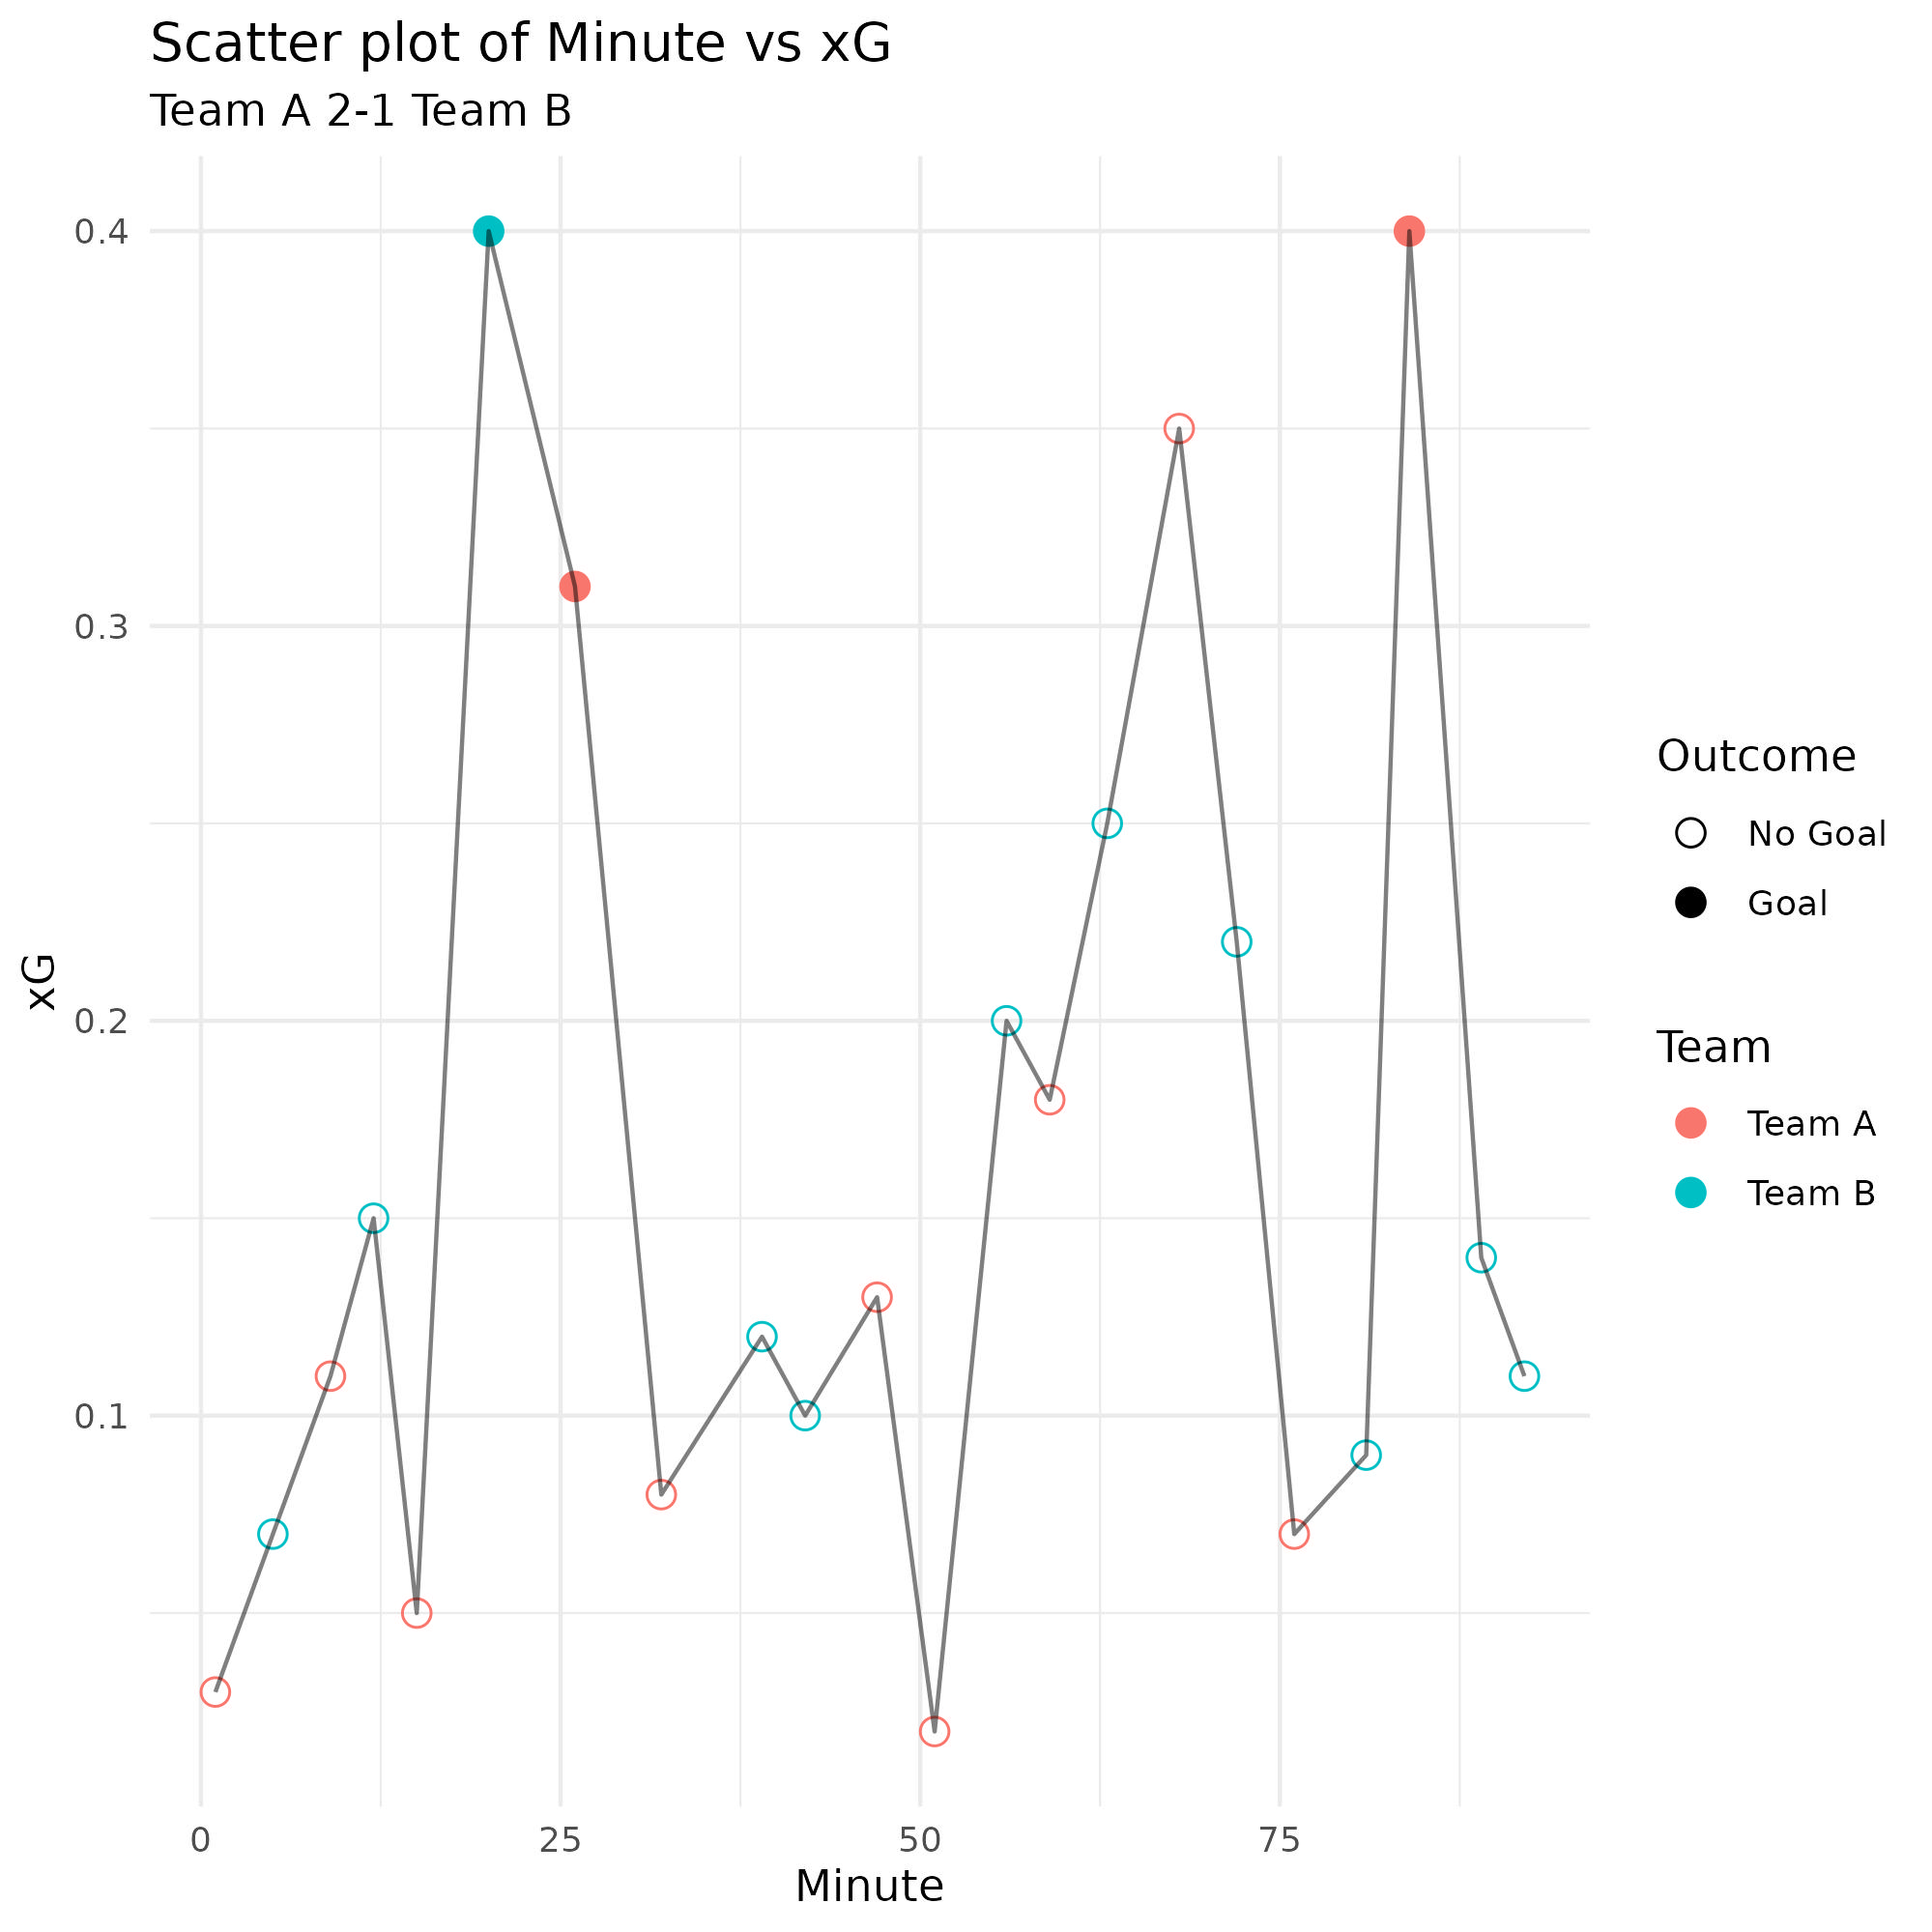
I also made a couple of plots of to explore how to represent xG data. This is from fake data I generated.
Finally, I made a game! It’s just a demo. It asks the player to watch a goal and guess what the xG of the shot was. The player’s score is determined by the Brier score. Unfortunately, I can’t keep it deploy right now, but here’s the code if you want to deploy and play it:
https://github.com/gfleetwood/the_xg_game